Visible Vowels
About
Visible Vowels is a web app for the analysis of acoustic vowel measurements: f0, formants and duration. The app is an useful instrument for research in phonetics, sociolinguistics, dialectology, forensic linguistics, and speech-language pathology. The following people were involved in the development of Visible Vowels: Wilbert Heeringa (implementation), Hans Van de Velde (project manager), Vincent van Heuven (advice). Visible Vowels is still under development. Comments are welcome and can be sent to
 .
.
System requirements
Visible Vowels runs best on a computer with a monitor with a minimum resolution of 1370 x 870 (width x height). The use of Mozilla Firefox as a web browser is to be preferred.
Format
The input file should be a spreadsheet that is created in Excel or LibreOffice. It should be saved as an Excel 2007/2010/2013 XML file, i.e. with extension '.xlsx'. Both a wide format and a long format are allowed. The program itself detects whether the wide format or the long format has been used. The spreadsheet should include the following variables (shown in red):
-
General
-
speaker
Contains the speaker labels. This column is obligatory.
-
vowel
Contains the vowel labels. Multiple pronunciations of the same vowel per speaker are possible. In case you want to use IPA characters, enter them as Unicode characters. In order to find Unicode IPA characters, use the online
IPA Chart Keyboard
of Weston Ruter. This column is obligatory.
-
timepoint
In this column the time points are labeled by numbers that indicate the order of the time points in the vowel interval. This column is obligatory only when using the long format.
-
Sociolinguistic
-
...
An arbitrary number of columns representing categorical variables such as location, language, gender, age group, etc. may follow, but is not obligatory. See to it that each categorical variable has an unique set of different values. Prevent the use of numbers, rather use meaningful codes. For example, rather then using codes '1' and '2' for a variable 'age group' use 'old' and 'young' or 'o' and 'y'.
-
Vowel
-
duration
Durations of the vowels. The measurements may be either in seconds or milliseconds. This column is obligatory but may be kept empty.
-
time f0 F1 F2 F3
A set of five columns should follow: 'time', 'f0', 'F1', 'F2' and 'F3'. The variable 'time' gives the time point at which f0, F1, F2 and F3 are measured. This time point within the vowel interval should be measured in seconds or milliseconds. It is assumed that the vowel interval starts at 0 (milli)seconds. It is assumed that f0, F1, F2 and F3 are measured in Hertz and not normalized. A set should always include all five columns, but the columns 'time', 'f0' and 'F3' may be kept empty.
As many
sets can be included as time points within the vowel interval are chosen. But a set should occur at least one time. When using the wide format, all the sets are found in the same row, and for each set the same column names should be used. When using the long format, each set is found in a seperate row, and rows that refer to the same realization are distinguished by the codes in the 'timepoint' column.
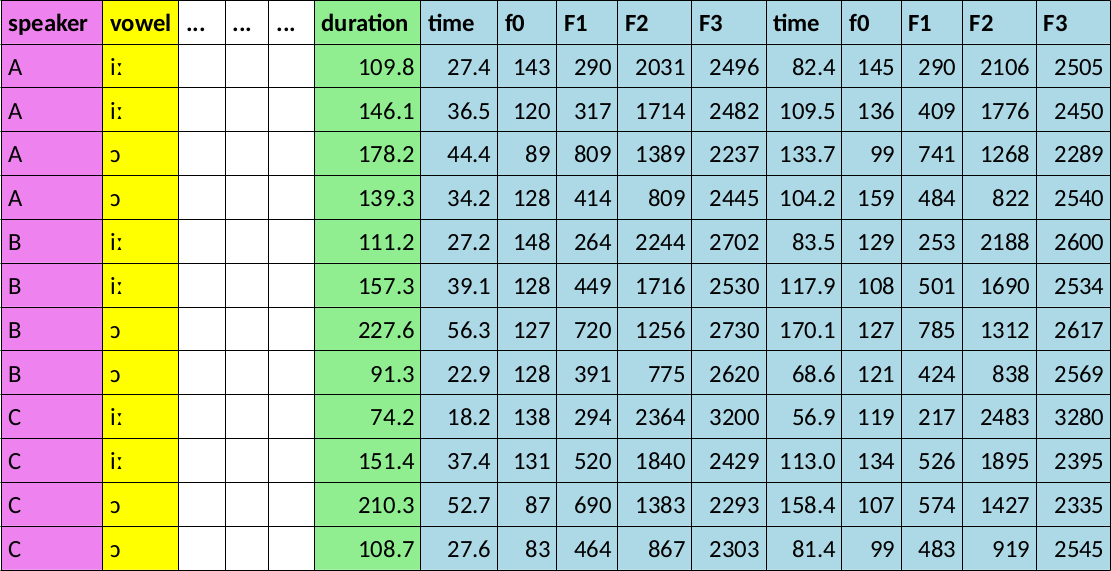
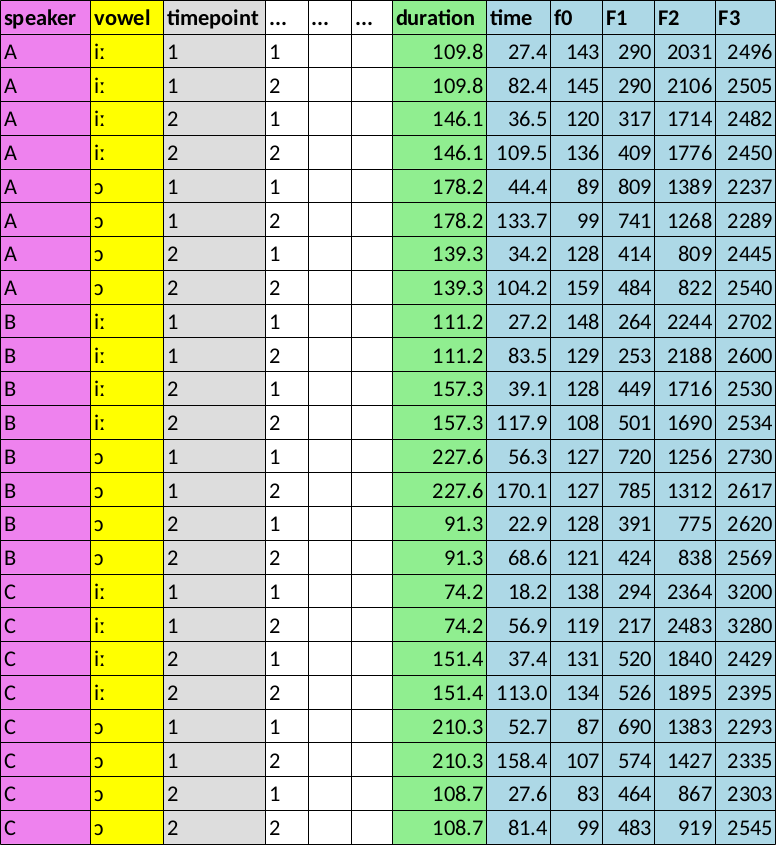
Below both the wide and the long format are schematically shown by means of an example. In this example there are three speakers labeled as 'A', 'B' and 'C'. Each of the speakers pronounced two different vowels: iː and ɔ. Each vowel has been pronounced twice by each speaker, and for each realization f0, F1, F2 and F3 are measured at two time points.
Note the importance of the numbers in the fourth column in the long table, where they make it clear which measurements at multiple time points relate to the same vowel realization. In fact, the long format requires that all cases in the table be uniquely defined by the combination of the 'speaker' variable, the 'vowel' variable, the 'timepoint' variable and the categorical variables that follow, i.e. the pink, yellow, grey and white columns to the left of the 'duration' variable.
Wide format
Long format
Example input file
In order to try Visible Vowels an example spreadsheet can be downloaded
here
and be loaded by this program.
Graphs
Graphs can be saved in six formats: JPG, PNG, SVG, EPS, PDF and TEX. TEX files are created with TikZ. When using this format, it is assumed that XeLaTeX is installed. Generating a TikZ may take a long time. When including a TikZ file in a LaTeX document, you need to use a font that supports the IPA Unicode characters, for example: 'Doulos SIL', 'Charis SIL' or 'Linux Libertine O'. You also need to adjust the left margin and the scaling of the graph. The LaTeX document should be compiled with
xelatex
. Example of a LaTeX file in which a TikZ file is included:
\documentclass{minimal}
\usepackage{tikz}
\usepackage{fontspec}
\setmainfont{Linux Libertine O}
\begin{document}
{\hspace*{-3cm}\scalebox{0.8}{\input{formantPlot.TEX}}}
\end{document}
Implementation
This program is implemented as a Shiny app. Shiny was developed by RStudio. This app uses the following R packages:
-
base
R Core Team (2017). R: A language and environment for statistical computing. R Foundation for Statistical Computing, Vienna, Austria. https://www.R-project.org/
-
shiny
Winston Chang, Joe Cheng, J.J. Allaire, Yihui Xie and Jonathan McPherson (2017). shiny: Web Application Framework for R. R package version 1.0.0. https://CRAN.R-project.org/package=shiny
-
shinyBS
Eric Bailey (2015). shinyBS: Twitter Bootstrap Components for Shiny. R package version 0.61. https://CRAN.R-project.org/package=shinyBS
-
tydr
Hadley Wickham and Lionel Henry (2019). tidyr: Tidy Messy Data. R package version 1.0.0. https://CRAN.R-project.org/package=tidyr
-
PBSmapping
Jon T. Schnute, Nicholas Boers and Rowan Haigh (2019). PBSmapping: Mapping Fisheries Data and Spatial Analysis Tools. R package version 2.72.1. https://CRAN.R-project.org/package=PBSmapping
-
splitstackshape
Ananda Mahto (2019). splitstackshape: Stack and Reshape Datasets After Splitting Concatenated Values. R package version 1.4.8. https://CRAN.R-project.org/package=splitstackshape
-
plyr
Hadley Wickham (2011). The Split-Apply-Combine Strategy for Data Analysis. Journal of Statistical Software, 40(1), 1-29. http://www.jstatsoft.org/v40/i01/
-
dplyr
Hadley Wickham, Romain François, Lionel Henry and Kirill Müller (2022). dplyr: A Grammar of Data Manipulation. R package version 1.0.10. https://CRAN.R-project.org/package=dplyr
-
formattable
Kun Ren and Kenton Russell (2016). formattable: Create 'Formattable' Data Structures. R package version 0.2.0.1. https://CRAN.R-project.org/package=formattable
-
ggplot2
H. Wickham (2009). ggplot2: Elegant Graphics for Data Analysis. Springer-Verlag New York. http://ggplot2.org
-
plot3D
Karline Soetaert (2017). plot3D: Plotting Multi-Dimensional Data. R package version 1.1.1. https://CRAN.R-project.org/package=plot3D
-
MASS
W.N. Venables & B.D. Ripley (2002). Modern Applied Statistics with S. Fourth Edition. Springer, New York. ISBN 0-387-95457-0
-
ggdendro
Andrie de Vries and Brian D. Ripley (2016). ggdendro: Create Dendrograms and Tree Diagrams Using 'ggplot2'. R package version 0.1-20. https://CRAN.R-project.org/package=ggdendro
-
ggrepel
Kamil Slowikowski (2017). ggrepel: Repulsive Text and Label Geoms for 'ggplot2'. R package version 0.7.0. https://CRAN.R-project.org/package=ggrepel
-
readxl
Hadley Wickham and Jennifer Bryan (2017). readxl: Read Excel Files. R package version 1.0.0. https://CRAN.R-project.org/package=readxl
-
WriteXLS
Marc Schwartz and various authors. (2015). WriteXLS: Cross-Platform Perl Based R Function to Create Excel 2003 (XLS) and Excel 2007 (XLSX) Files. R package version 4.0.0. https://CRAN.R-project.org/package=WriteXLS
-
DT
Yihui Xie (2016). DT: A Wrapper of the JavaScript Library 'DataTables'. R package version 0.2. https://CRAN.R-project.org/package=DT
-
psych
William Revelle (2016). psych: Procedures for Personality and Psychological Research, Northwestern University, Evanston, Illinois, USA, Version = 1.6.12, https://CRAN.R-project.org/package=psych
-
pracma
Hans Werner Borchers (2017). pracma: Practical Numerical Math Functions. R package version 1.9.9. https://CRAN.R-project.org/package=pracma
-
Rtsne
Jesse H. Krijthe (2015). Rtsne: T-Distributed Stochastic Neighbor Embedding using a Barnes-Hut Implementation. https://github.com/jkrijthe/Rtsne
L.J.P. van der Maaten and G.E. Hinton (2008). Visualizing High-Dimensional Data Using t-SNE. Journal of Machine Learning Research 9(Nov):2579-2605
L.J.P. van der Maaten (2014). Accelerating t-SNE using Tree-Based Algorithms. Journal of Machine Learning Research 15(Oct):3221-3245
-
vegan
Oksanen J, Simpson G, Blanchet F, Kindt R, Legendre P, Minchin P, O'Hara R, Solymos P, Stevens M, Szoecs E, Wagner H, Barbour M, Bedward M, Bolker B, Borcard D, Borman T, Carvalho G, Chirico M, De Caceres M, Durand S, Evangelista H, FitzJohn R, Friendly M, Furneaux B, Hannigan G, Hill M, Lahti L, Martino C, McGlinn D, Ouellette M, Ribeiro Cunha E, Smith T, Stier A, Ter Braak C, Weedon J (2025). _vegan: Community Ecology Package_. R package version 2.7-1. https://doi.org/10.32614/CRAN.package.vegan
-
effectsize
Ben-Shachar M, Lüdecke D, Makowski D (2020). effectsize: Estimation of Effect Size Indices and Standardized Parameters. Journal of Open Source Software, 5(56), 2815. R package version 1.0.1. https://doi.org/10.21105/joss.02815
-
svglite
Hadley Wickham, Lionel Henry, T Jake Luciani, Matthieu Decorde and Vaudor Lise (2016). svglite: An 'SVG' Graphics Device. R package version 1.2.0. https://CRAN.R-project.org/package=svglite
-
Cairo
Simon Urbanek and Jeffrey Horner (2015). Cairo: R graphics device using cairo graphics library for creating high-quality bitmap (PNG, JPEG, TIFF), vector (PDF, SVG, PostScript) and display (X11 and Win32) output. R package version 1.5-9. https://CRAN.R-project.org/package=Cairo
-
tikzDevice
Charlie Sharpsteen and Cameron Bracken (2020). tikzDevice: R Graphics Output in LaTeX Format. R package version 0.12.3.1. https://CRAN.R-project.org/package=tikzDevice
-
shinybusy
Fanny Meyer and Victor Perrier (2020). shinybusy: Busy Indicator for 'Shiny' Applications. R package version 0.2.2. https://CRAN.R-project.org/package=shinybusy
Visible Vowels allows to convert and normalize vowel data and calculate some specific metrics. The document
here
explains how these values are calculated.
How to cite this app
Heeringa, W. & Van de Velde, H. (2018). “Visible Vowels: a Tool for the Visualization of Vowel Variation.” In
Proceedings CLARIN Annual Conference 2018, 8 - 10 October, Pisa, Italy.
CLARIN ERIC.
Tutorial
Click
here
for a tutorial that guides you through Visible Vowels and shows all its possibilities.
Privacy
This app uses cookies that are used to collect data. By using this site you agree to these cookies being set. Google Analytics is used in order to track and report website traffic. See:
How Google uses data when you use our partners' sites or apps
.
Liability
This app is provided 'as is' without warranty of any kind, either express or implied, including, but not limited to, the implied warranties of fitness for a purpose, or the warranty of non-infringement. Without limiting the foregoing, the Fryske Akademy makes no warranty that: 1) the app will meet your requirements, 2) the app will be uninterrupted, timely, secure or error-free, 3) the results that may be obtained from the use of the app will be effective, accurate or reliable, 4) the quality of the app will meet your expectations, 5) any errors in the app will be corrected.
The app and its documentation could include technical or other mistakes, inaccuracies or typographical errors. The Fryske Akademy may make changes to the app or documentation made available on its web site. The app and its documentation may be out of date, and the Fryske Akademy makes no commitment to update such materials.
The Fryske Akademy assumes no responsibility for errors or ommissions in the app or documentation available from its web site.
In no event shall the Fryske Akademy be liable to you or any third parties for any special, punitive, incidental, indirect or consequential damages of any kind, or any damages whatsoever, including, without limitation, those resulting from loss of use, data or profits, whether or not the Fryske Akademy has been advised of the possibility of such damages, and on any theory of liability, arising out of or in connection with the use of this software.
The use of the app is done at your own discretion and risk and with agreement that you will be solely responsible for any damage to your computer system or loss of data that results from such activities. No advice or information, whether oral or written, obtained by you from the Fryske Akademy shall create any warranty for the software.
Other
The disclaimer may be changed from time to time.
About
Visible Vowels is a web app for the analysis of acoustic vowel measurements: f0, formants and duration. The app is an useful instrument for research in phonetics, sociolinguistics, dialectology, forensic linguistics, and speech-language pathology. The following people were involved in the development of Visible Vowels: Wilbert Heeringa (implementation), Hans Van de Velde (project manager), Vincent van Heuven (advice). Visible Vowels is still under development. Comments are welcome and can be sent to
![]() .
.
System requirements
Visible Vowels runs best on a computer with a monitor with a minimum resolution of 1370 x 870 (width x height). The use of Mozilla Firefox as a web browser is to be preferred.
Format
The input file should be a spreadsheet that is created in Excel or LibreOffice. It should be saved as an Excel 2007/2010/2013 XML file, i.e. with extension '.xlsx'. Both a wide format and a long format are allowed. The program itself detects whether the wide format or the long format has been used. The spreadsheet should include the following variables (shown in red):
-
General
-
speaker
Contains the speaker labels. This column is obligatory.
-
vowel
Contains the vowel labels. Multiple pronunciations of the same vowel per speaker are possible. In case you want to use IPA characters, enter them as Unicode characters. In order to find Unicode IPA characters, use the online IPA Chart Keyboard of Weston Ruter. This column is obligatory.
-
timepoint
In this column the time points are labeled by numbers that indicate the order of the time points in the vowel interval. This column is obligatory only when using the long format.
-
speaker
-
Sociolinguistic
-
...
An arbitrary number of columns representing categorical variables such as location, language, gender, age group, etc. may follow, but is not obligatory. See to it that each categorical variable has an unique set of different values. Prevent the use of numbers, rather use meaningful codes. For example, rather then using codes '1' and '2' for a variable 'age group' use 'old' and 'young' or 'o' and 'y'.
-
...
-
Vowel
-
duration
Durations of the vowels. The measurements may be either in seconds or milliseconds. This column is obligatory but may be kept empty.
-
time f0 F1 F2 F3
A set of five columns should follow: 'time', 'f0', 'F1', 'F2' and 'F3'. The variable 'time' gives the time point at which f0, F1, F2 and F3 are measured. This time point within the vowel interval should be measured in seconds or milliseconds. It is assumed that the vowel interval starts at 0 (milli)seconds. It is assumed that f0, F1, F2 and F3 are measured in Hertz and not normalized. A set should always include all five columns, but the columns 'time', 'f0' and 'F3' may be kept empty. As many sets can be included as time points within the vowel interval are chosen. But a set should occur at least one time. When using the wide format, all the sets are found in the same row, and for each set the same column names should be used. When using the long format, each set is found in a seperate row, and rows that refer to the same realization are distinguished by the codes in the 'timepoint' column.
-
duration
Below both the wide and the long format are schematically shown by means of an example. In this example there are three speakers labeled as 'A', 'B' and 'C'. Each of the speakers pronounced two different vowels: iː and ɔ. Each vowel has been pronounced twice by each speaker, and for each realization f0, F1, F2 and F3 are measured at two time points.
Note the importance of the numbers in the fourth column in the long table, where they make it clear which measurements at multiple time points relate to the same vowel realization. In fact, the long format requires that all cases in the table be uniquely defined by the combination of the 'speaker' variable, the 'vowel' variable, the 'timepoint' variable and the categorical variables that follow, i.e. the pink, yellow, grey and white columns to the left of the 'duration' variable.
Wide format
Long format
Example input file
In order to try Visible Vowels an example spreadsheet can be downloaded here and be loaded by this program.
Graphs
Graphs can be saved in six formats: JPG, PNG, SVG, EPS, PDF and TEX. TEX files are created with TikZ. When using this format, it is assumed that XeLaTeX is installed. Generating a TikZ may take a long time. When including a TikZ file in a LaTeX document, you need to use a font that supports the IPA Unicode characters, for example: 'Doulos SIL', 'Charis SIL' or 'Linux Libertine O'. You also need to adjust the left margin and the scaling of the graph. The LaTeX document should be compiled with
xelatex
. Example of a LaTeX file in which a TikZ file is included:
\documentclass{minimal}
\usepackage{tikz}
\usepackage{fontspec}
\setmainfont{Linux Libertine O}
\begin{document}
{\hspace*{-3cm}\scalebox{0.8}{\input{formantPlot.TEX}}}
\end{document}
Implementation
This program is implemented as a Shiny app. Shiny was developed by RStudio. This app uses the following R packages:
-
base
R Core Team (2017). R: A language and environment for statistical computing. R Foundation for Statistical Computing, Vienna, Austria. https://www.R-project.org/
-
shiny
Winston Chang, Joe Cheng, J.J. Allaire, Yihui Xie and Jonathan McPherson (2017). shiny: Web Application Framework for R. R package version 1.0.0. https://CRAN.R-project.org/package=shiny
-
shinyBS
Eric Bailey (2015). shinyBS: Twitter Bootstrap Components for Shiny. R package version 0.61. https://CRAN.R-project.org/package=shinyBS
-
tydr
Hadley Wickham and Lionel Henry (2019). tidyr: Tidy Messy Data. R package version 1.0.0. https://CRAN.R-project.org/package=tidyr
-
PBSmapping
Jon T. Schnute, Nicholas Boers and Rowan Haigh (2019). PBSmapping: Mapping Fisheries Data and Spatial Analysis Tools. R package version 2.72.1. https://CRAN.R-project.org/package=PBSmapping
-
splitstackshape
Ananda Mahto (2019). splitstackshape: Stack and Reshape Datasets After Splitting Concatenated Values. R package version 1.4.8. https://CRAN.R-project.org/package=splitstackshape
-
plyr
Hadley Wickham (2011). The Split-Apply-Combine Strategy for Data Analysis. Journal of Statistical Software, 40(1), 1-29. http://www.jstatsoft.org/v40/i01/
-
dplyr
Hadley Wickham, Romain François, Lionel Henry and Kirill Müller (2022). dplyr: A Grammar of Data Manipulation. R package version 1.0.10. https://CRAN.R-project.org/package=dplyr
-
formattable
Kun Ren and Kenton Russell (2016). formattable: Create 'Formattable' Data Structures. R package version 0.2.0.1. https://CRAN.R-project.org/package=formattable
-
ggplot2
H. Wickham (2009). ggplot2: Elegant Graphics for Data Analysis. Springer-Verlag New York. http://ggplot2.org
-
plot3D
Karline Soetaert (2017). plot3D: Plotting Multi-Dimensional Data. R package version 1.1.1. https://CRAN.R-project.org/package=plot3D
-
MASS
W.N. Venables & B.D. Ripley (2002). Modern Applied Statistics with S. Fourth Edition. Springer, New York. ISBN 0-387-95457-0
-
ggdendro
Andrie de Vries and Brian D. Ripley (2016). ggdendro: Create Dendrograms and Tree Diagrams Using 'ggplot2'. R package version 0.1-20. https://CRAN.R-project.org/package=ggdendro
-
ggrepel
Kamil Slowikowski (2017). ggrepel: Repulsive Text and Label Geoms for 'ggplot2'. R package version 0.7.0. https://CRAN.R-project.org/package=ggrepel
-
readxl
Hadley Wickham and Jennifer Bryan (2017). readxl: Read Excel Files. R package version 1.0.0. https://CRAN.R-project.org/package=readxl
-
WriteXLS
Marc Schwartz and various authors. (2015). WriteXLS: Cross-Platform Perl Based R Function to Create Excel 2003 (XLS) and Excel 2007 (XLSX) Files. R package version 4.0.0. https://CRAN.R-project.org/package=WriteXLS
-
DT
Yihui Xie (2016). DT: A Wrapper of the JavaScript Library 'DataTables'. R package version 0.2. https://CRAN.R-project.org/package=DT
-
psych
William Revelle (2016). psych: Procedures for Personality and Psychological Research, Northwestern University, Evanston, Illinois, USA, Version = 1.6.12, https://CRAN.R-project.org/package=psych
-
pracma
Hans Werner Borchers (2017). pracma: Practical Numerical Math Functions. R package version 1.9.9. https://CRAN.R-project.org/package=pracma
-
Rtsne
Jesse H. Krijthe (2015). Rtsne: T-Distributed Stochastic Neighbor Embedding using a Barnes-Hut Implementation. https://github.com/jkrijthe/Rtsne
L.J.P. van der Maaten and G.E. Hinton (2008). Visualizing High-Dimensional Data Using t-SNE. Journal of Machine Learning Research 9(Nov):2579-2605
L.J.P. van der Maaten (2014). Accelerating t-SNE using Tree-Based Algorithms. Journal of Machine Learning Research 15(Oct):3221-3245
-
vegan
Oksanen J, Simpson G, Blanchet F, Kindt R, Legendre P, Minchin P, O'Hara R, Solymos P, Stevens M, Szoecs E, Wagner H, Barbour M, Bedward M, Bolker B, Borcard D, Borman T, Carvalho G, Chirico M, De Caceres M, Durand S, Evangelista H, FitzJohn R, Friendly M, Furneaux B, Hannigan G, Hill M, Lahti L, Martino C, McGlinn D, Ouellette M, Ribeiro Cunha E, Smith T, Stier A, Ter Braak C, Weedon J (2025). _vegan: Community Ecology Package_. R package version 2.7-1. https://doi.org/10.32614/CRAN.package.vegan
-
effectsize
Ben-Shachar M, Lüdecke D, Makowski D (2020). effectsize: Estimation of Effect Size Indices and Standardized Parameters. Journal of Open Source Software, 5(56), 2815. R package version 1.0.1. https://doi.org/10.21105/joss.02815
-
svglite
Hadley Wickham, Lionel Henry, T Jake Luciani, Matthieu Decorde and Vaudor Lise (2016). svglite: An 'SVG' Graphics Device. R package version 1.2.0. https://CRAN.R-project.org/package=svglite
-
Cairo
Simon Urbanek and Jeffrey Horner (2015). Cairo: R graphics device using cairo graphics library for creating high-quality bitmap (PNG, JPEG, TIFF), vector (PDF, SVG, PostScript) and display (X11 and Win32) output. R package version 1.5-9. https://CRAN.R-project.org/package=Cairo
-
tikzDevice
Charlie Sharpsteen and Cameron Bracken (2020). tikzDevice: R Graphics Output in LaTeX Format. R package version 0.12.3.1. https://CRAN.R-project.org/package=tikzDevice
-
shinybusy
Fanny Meyer and Victor Perrier (2020). shinybusy: Busy Indicator for 'Shiny' Applications. R package version 0.2.2. https://CRAN.R-project.org/package=shinybusy
Visible Vowels allows to convert and normalize vowel data and calculate some specific metrics. The document here explains how these values are calculated.
How to cite this app
Heeringa, W. & Van de Velde, H. (2018). “Visible Vowels: a Tool for the Visualization of Vowel Variation.” In Proceedings CLARIN Annual Conference 2018, 8 - 10 October, Pisa, Italy. CLARIN ERIC.
Tutorial
Click here for a tutorial that guides you through Visible Vowels and shows all its possibilities.
Privacy
This app uses cookies that are used to collect data. By using this site you agree to these cookies being set. Google Analytics is used in order to track and report website traffic. See: How Google uses data when you use our partners' sites or apps .
Liability
This app is provided 'as is' without warranty of any kind, either express or implied, including, but not limited to, the implied warranties of fitness for a purpose, or the warranty of non-infringement. Without limiting the foregoing, the Fryske Akademy makes no warranty that: 1) the app will meet your requirements, 2) the app will be uninterrupted, timely, secure or error-free, 3) the results that may be obtained from the use of the app will be effective, accurate or reliable, 4) the quality of the app will meet your expectations, 5) any errors in the app will be corrected.
The app and its documentation could include technical or other mistakes, inaccuracies or typographical errors. The Fryske Akademy may make changes to the app or documentation made available on its web site. The app and its documentation may be out of date, and the Fryske Akademy makes no commitment to update such materials.
The Fryske Akademy assumes no responsibility for errors or ommissions in the app or documentation available from its web site.
In no event shall the Fryske Akademy be liable to you or any third parties for any special, punitive, incidental, indirect or consequential damages of any kind, or any damages whatsoever, including, without limitation, those resulting from loss of use, data or profits, whether or not the Fryske Akademy has been advised of the possibility of such damages, and on any theory of liability, arising out of or in connection with the use of this software.
The use of the app is done at your own discretion and risk and with agreement that you will be solely responsible for any damage to your computer system or loss of data that results from such activities. No advice or information, whether oral or written, obtained by you from the Fryske Akademy shall create any warranty for the software.
Other
The disclaimer may be changed from time to time.